The FinLab Toolkit

HUMAN CENTERED DESIGN | DEFINE

Attribute Scale

60-90 Min

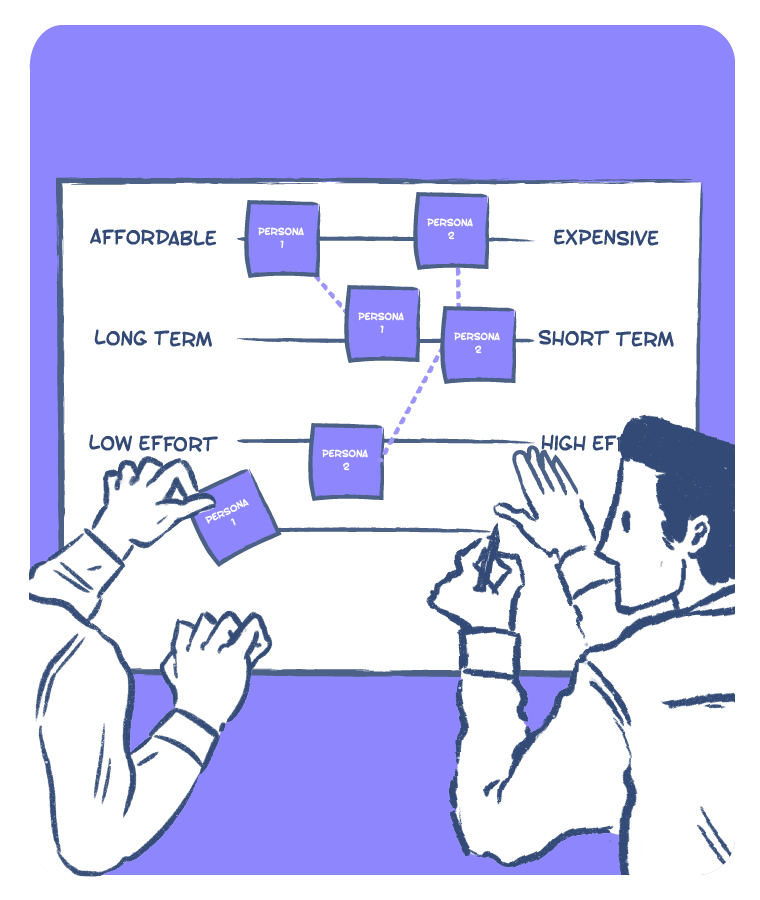
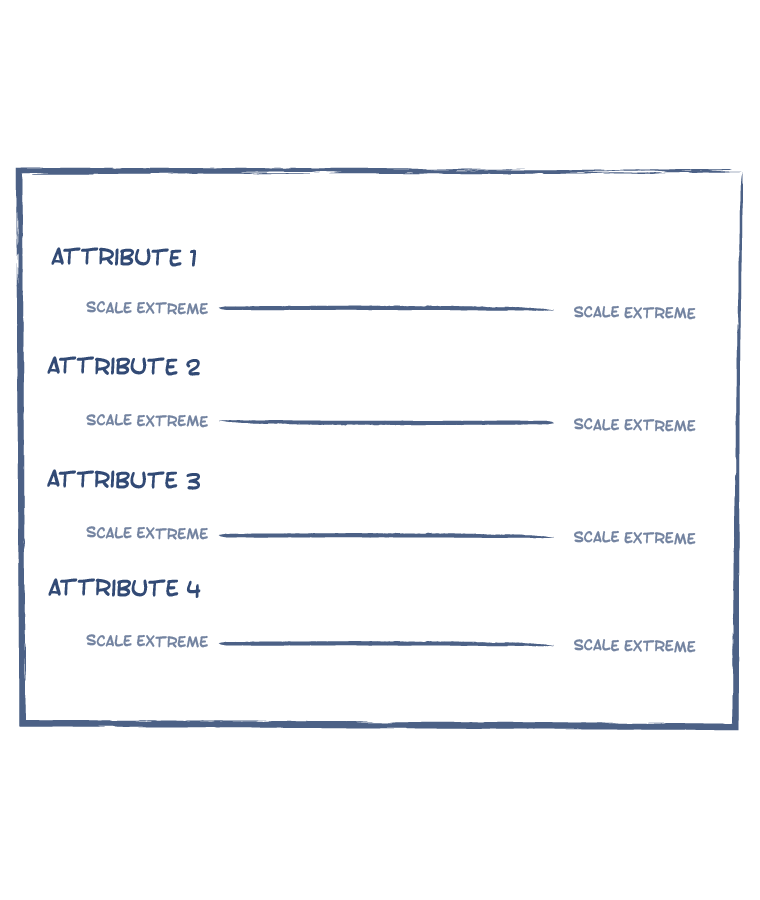
Attribute Scale is a tool that helps compare entities with regard to different product, service, and system attributes.

USE CASES

  • Map and compare the experience of current users with regard to different product or service attributes.
  • Map and compare attitudes and needs of potential users with regard to attributes of a future product or service.
  • Inform the build of personas and profiles, and map how different personas and profiles differ.
  • Compare organisations on different attributes; product features, service experience, brand perception, etc.

LIMITATIONS

The use of Attribute Scale is dependent on a clear understanding of entities and attributes that need to be compared, and what the comparison will help uncover.

UNDERSTANDING THE TOOL

  • Attributes’ are the qualities/features/offerings. For example, pricing, personalisation, digitisation, frequency of mailers, etc, - that teams may want to compare entities on. The choice of the number of attributes is flexible.
  • Scales’ serve as a measure for attributes. They are used to score entities, and are typically defined by two extremes points (low — high) or in terms of opposites (physical — digital).
  • Entities’ are those things that need to be compared. These could be users (for example, young, middle age, old customers), competitors (for example, startups, small companies, established companies), products and services (for example, different car models, apps, banking experiences), geographies (for example, rural, urban, peri urban), etc.
  • Scores’ are points on the attribute scales that best describe an entity.
  • Score lines connect scores of one entity across the different attributes, creating a visual path that can be used for comparison between entities.
  • Patterns are the visual trends that emerge once the mapping of score lines is complete.

STEP BY STEP

  1. Define scope: Start by defining the scope of the comparison exercise; what is being compared, who is being compared, why is the comparison important.
  2. Map attributes, scale and entities: Make a list of attributes that are most important to map, and define relevant scales for each of the attributes. Next, select entities that need to be compared.
  3. Map scores: Go attribute by attribute, and map each entity on the scales. Draw lines to connect scores on each attribute (for each entity).
  4. Review patterns and discuss: Review emerging patterns, and discuss learnings and insights.

HOW TO FOR FACILITATORS

  1. At the start: Make sure participants understand the goal of the activity and directions. Refer to facilitation questions if they are feeling stuck.
  2. During the exercise: Start with a discussion on attributes and entities that need to be mapped. Ask the teams to define scales for each attribute. Guide them as they start to map scores, and draw score lines.
  3. At the close: Have participants walk you through the worksheet, and discuss patterns and insights.

FACILITATORS QUESTION BANK

  • What are you looking to map during this exercise? What will the attribute mapping help you achieve?
  • Are you clear on the attributes? How did you arrive at them?
  • Who are the entities; users, organisations, products, or something else? How did you choose them?
  • Are your scales for each attribute defined? How did you arrive at these scales?
  • How will you scope the entities? Individually or as a group?
  • Can you see patterns emerging as you draw the score lines? What do the patterns mean?
  • How has the comparison created clarity for the team?